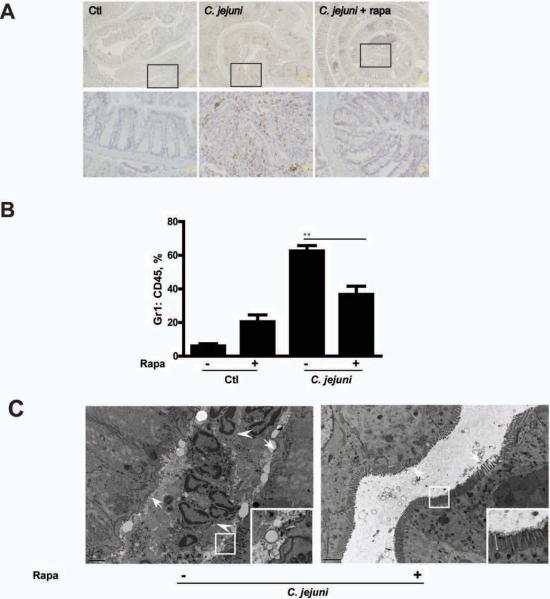
Figure 5. Neutrophils participate in C. jejuni induced colitis.
Cohorts of 5–7 germ-free Il10−/−; NF-κBEGFP mice were transferred to SPF conditions and infected/treated as indicated in Fig.1. (A) IHC representation of MPO positive colonic cells (brown dots) in Control (Ctl), C. jejuni infected, rapamycin (Rapa) treated mice. Lower panels (scale bar 20 μm) are magnified images of area shown in the upper panels (scale bar 200 μm). (B) Flow cytometry analysis for CD45+ and Gr-1+ cells in the peripheral blood of infected and rapamycin-treated mice. (C) TEM images of colonic tissues from C. jejuni infected with/without rapamycin treatment. Left panel shows accumulated neutrophils (arrow heads) in a crypt with microvilli erosion (arrows). Right panel shows absence of neutrophils with intact microvilli (arrows). Inserts in the lower right corners are magnified images of framed area. Scale bar is 2 μm. Data represent means ± SE **, P < 0.01. Results are representative of 3 independent experiments.

