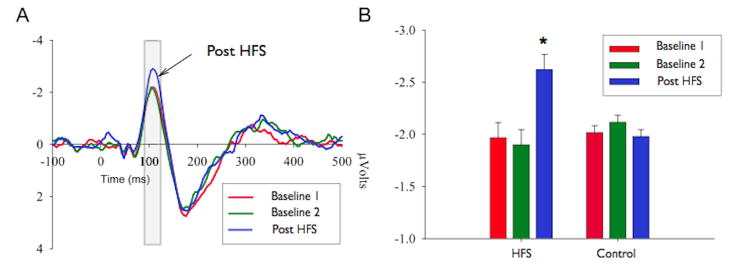
Figure 2.
Auditory HFS induces LTP of the N1 component. A) Group average Auditory Evoked Potentials (AEP) to tone pip stimulation. The grey section indicates the time window of interest. The red and green lines represent the 2 baseline blocks (pre HFS) and the blue line indicates the post-HFS AEP. Note that the post-HFS response is substantially larger than the two baseline blocks in the time window of interest (N1). B) Group average N1 amplitudes are shown for the two pre-HFS baseline periods, and the post-HFS period. The data reveals that only the group of subjects that received an auditory HFS had a significantly larger N1 amplitude (p<.05). Error bars represent the standard error of the mean (SEM) (12).

