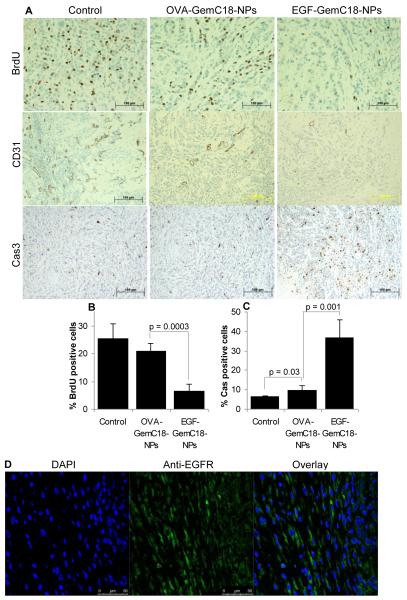
Figure 5. Immunohistographs of MDA-MB-468 tumors after treatment with EGF-GemC18-NPs or OVA-GemC18-NPs.
(A). Tumor tissues were staining with antibodies against BrdU, CD31, or caspase 3 (Cas 3). Scale bars = 100 μm.
(B). The % of BrdU positive cells.
(C). The % of caspase 3 positive cells.
(D). Tumor tissues after anti-EGFR antibody staining (green) and DAPI staining (blue).

