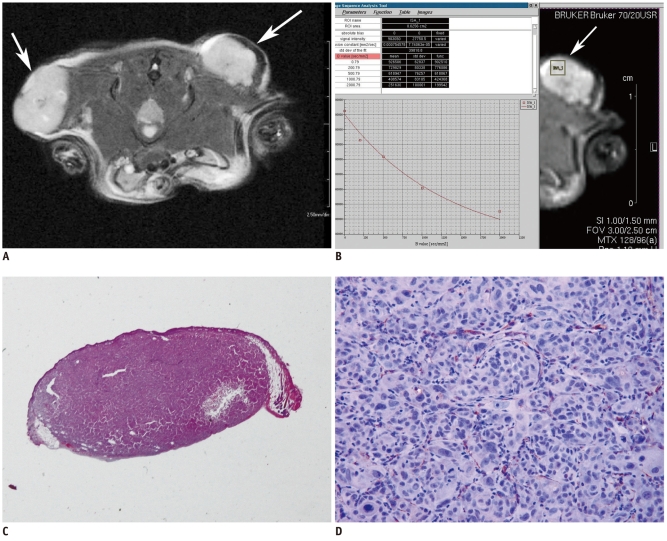
Fig. 1.
Human prostate cancer cell (PC-3) induced bilateral subcutaneous tumors on flank of athymic mouse.
A. T2-weighted MR images (Bruker RARE sequence; field of view = 3 × 2.5 cm, matrix = 256 × 256, spatial resolution = 117 × 98 µm/pixel, slice thickness = 1.0 mm, repetition time = 2500 ms, TEeff = 36.0 ms) of axial planes show homogeneous high signal intensity mass in injected area of both backs (arrows). B. Rectangular region of interest was placed within left tumor on axial plane of heavily T2 weighted MR image. Console program shows process of calculating apparent diffusion coefficient value of pixel area in region of interest. Apparent diffusion coefficient values for region of interest as well as apparent diffusion coefficient map could be calculated from following equation: Y = A + I * exp (-b * D). These parameters are defined as follows: Y: image intensity, A: absolute bias, I: multiplication constant, b: diffusion b-value and D: diffusion constant. This function (supplied by BRUKER®) uses b-value list calculated to generate x-axis. Fit is based on magnitude images of reconstructed data set using least squares mono exponential fitting. C. Photography of entire section (× 10) in pathological specimen stained with Hematoxylin and Eosin staining. Analysis program developed with visual C++ automatically performed calculation of percentage (%) of necrosis within tumor. D. Photomicrograph of immunohistochemical staining shows CD31 expression; microvessels stained with CD-31 were counted in four adjacent fields at × 200.

