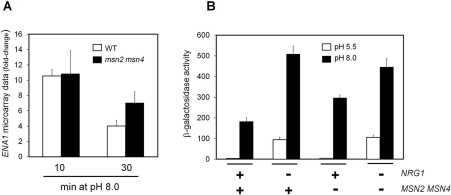
Figure 7. Dependence of ENA1 expression on the presence of Msn2/Msn4.
(A) Fold-change of ENA1 expression deduced from microarray data for W303-1A wild-type cells (WT, empty bars) and MCY5278 (msn2 msn4, filled bars) exposed to pH 8.0 for the indicated times. Results are means±S.E.M. from four microarray experiments. (B) Strains with the indicated genotype (+, wild type allele; -, deletion mutant) were transformed with plasmid pKC201, which bears a LacZ fusion of the ENA1 promoter. Exponential cultures were resuspended in medium buffered at pH 5.5 (empty bars) or pH 8.0 (filled bars) for 1 h and β-galactosidase activity was measured. Results are means±S.E.M. from six to nine independent experiments.

