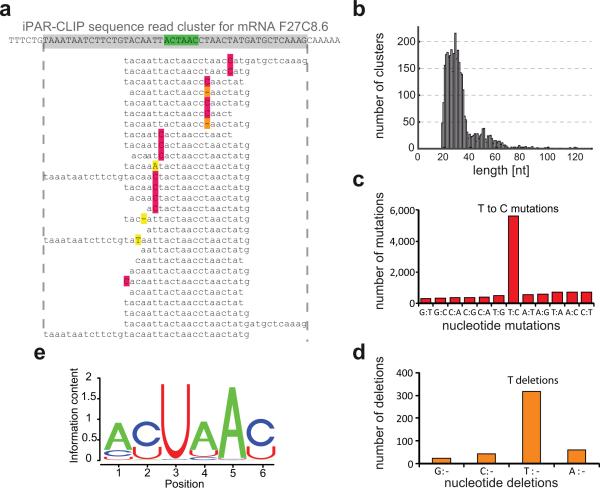
Figure 2. Identification of GLD-1 target sites by iPAR-CLIP.
(a) Sequence reads obtained by iPAR-CLIP were mapped to C. elegans mRNAs and, after removing redundant reads, organized into sequence read clusters (GLD-1 binding motif highlighted in green, T to C conversions in red, T deletions in orange). (b) Length distribution of the identified sequence read clusters. In the sequence read clusters, T to C mutations (c) and T deletions (d) were ~10 fold enriched over other types of mutations or deletions. (e) GLD-1 binding motif (p value < 10−250) identified in the top 100 clusters using MEME.

