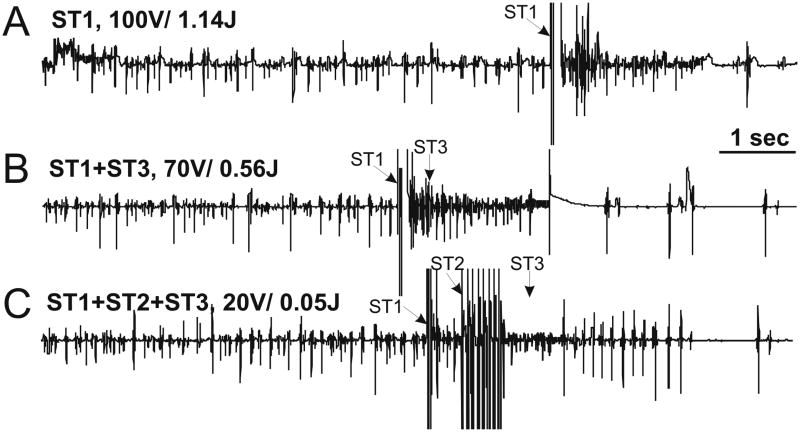
Figure 7.
Representative Atrial Electrograms of AF Terminations. For each panel, peak voltage in Stage 1 (ST1) and total energy is denoted above the corresponding atrial electrogram. The time that each individual therapy was delivered is indicated with an arrow. A: ST1 therapy of two 100 V biphasic shocks (total energy 1.14 J) terminated AF. B: Stage 1 plus Stage 3 (ST1+ST3) lowered the peak voltage of ST1 to 70 V and the atrial defibrillation threshold (DFT) to 0.56 J. C: Three-stage therapy (ST1+ST2+ST3) dramatically reduced the total energy to 0.05 J and the peak voltage of ST1 to 20 V.

