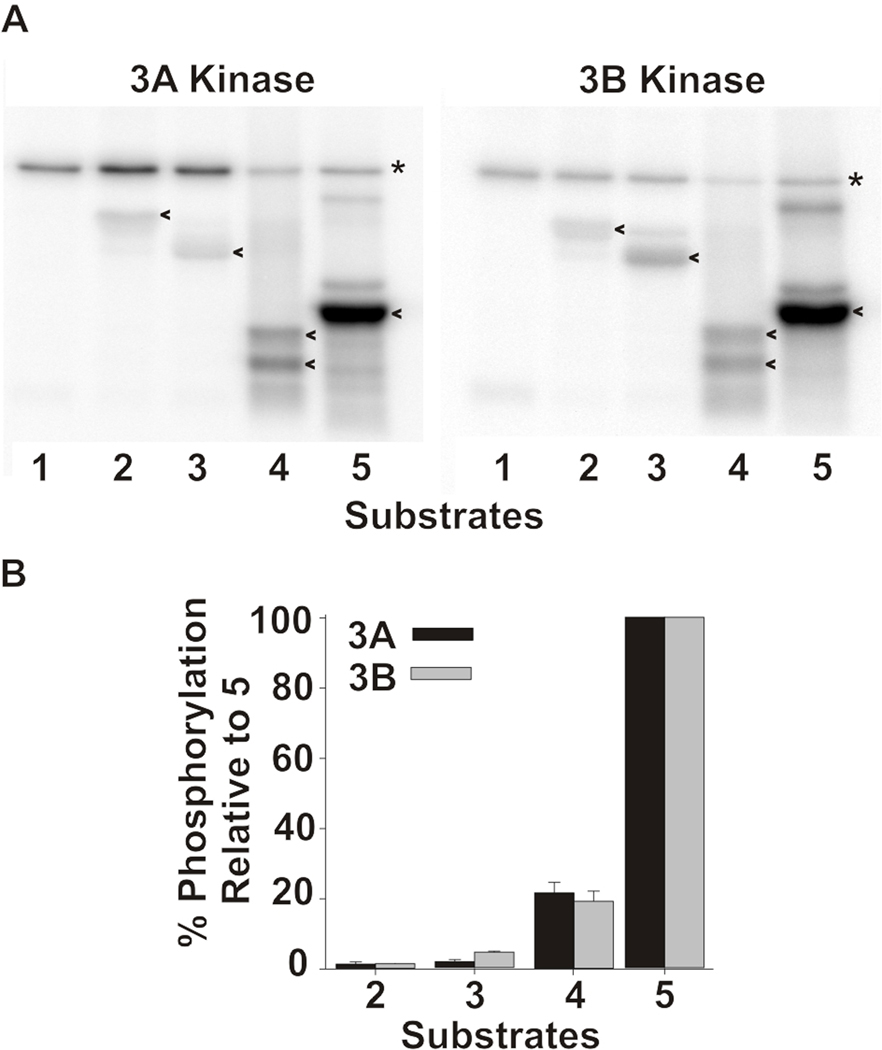
Figure 4. mMyo3A and 3B kinases show similar specificities for different protein substrates.
A. Phosphorimages of dried SDS-PAGE gels showing the incorporation of 32P from γ32P ATP into the kinase domains (asterisk)(0.4µmol/L) and different protein substrates (20 µmol/L)(arrow heads). Substrates assayed were: 1. none. 2. α casein. 3. β casein. 4. histone. 5. myelin basic protein. B. Intensities of the phosphorylated substrate bands were quantified with ImageQuant in three separate experiments. The levels of phosphorylation in each experiment were normalized to the level of phosphorylation observed with the substrate in lane 5 and expressed as the mean % of that phosphorylation ± the standard error of the means. The substrates are as listed in A.

