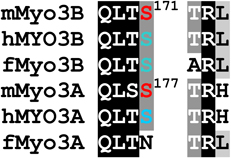
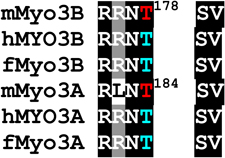
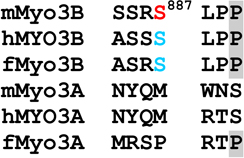
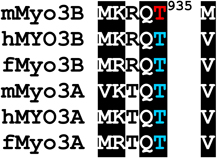
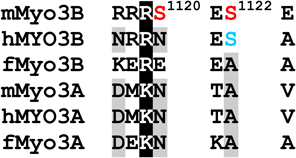
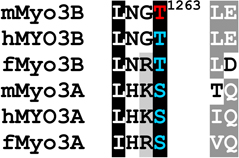
Table 1.
Alignments of mouse, human and fish class III myosins in those regions where mMyo3B contains a phosphorylated residue.
Regions are as described in Figure 1
Alignments of sequences from the database were performed in ClustalW. Amino acids highlighted in black are conserved in all six sequences, those in dark gray are conserved in five of the six sequences; those in light gray are conserved in at least four of the six sequences Amino acids in red were identified as autophosphorylation sites in this study; those in blue are predicted autophosphorylation sites. Superscript numbers indicate the position of the autophosphorylated residue in the sequence of mMyo3B or 3A. See Figure 1. Accession numbers: mMyo3A, AY101368; mMyo3B, NM_177376; hMYO3B (human), AF369908; hMYO3A, BC119811; fMyo3B (fish, bass), AF512506; fMyo3A, AF003249.

