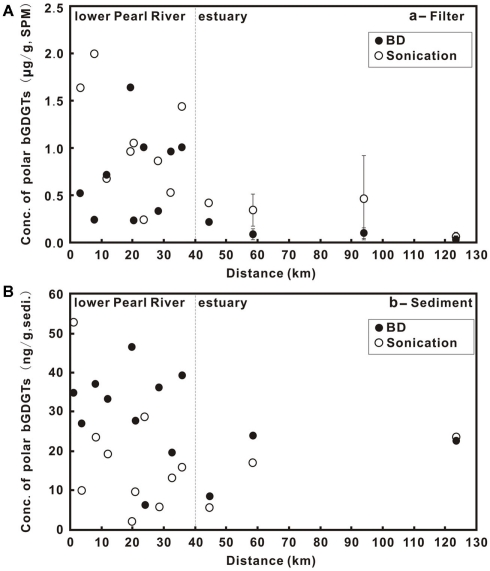
Figure 2.
Core (C)- and polar(P)-lipids (L) of bGDGTs in the water column (A) and sediments (B) from the lower Pearl River to the estuary. Zero distance is arbitrarily set at PR-9 in Figure 1 and increasing distance is toward the estuary. The error bars in (A) represent SD of the average values between the surface water- and the bottom water samples in the estuary.

