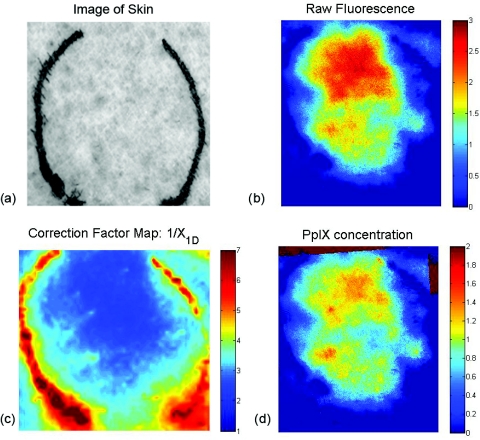
Figure 3.
In vivo example. (a) Image of skin tissue (volar forearm) prior to application of topical ALA, (b) raw fluorescence image, 7 h after application of ALA, (scale bar: arbitrary units). (c) Correction map (1/X1D) based on measured optical properties and (d) corrected fluorescence image (scale bar units: μg/ml).

