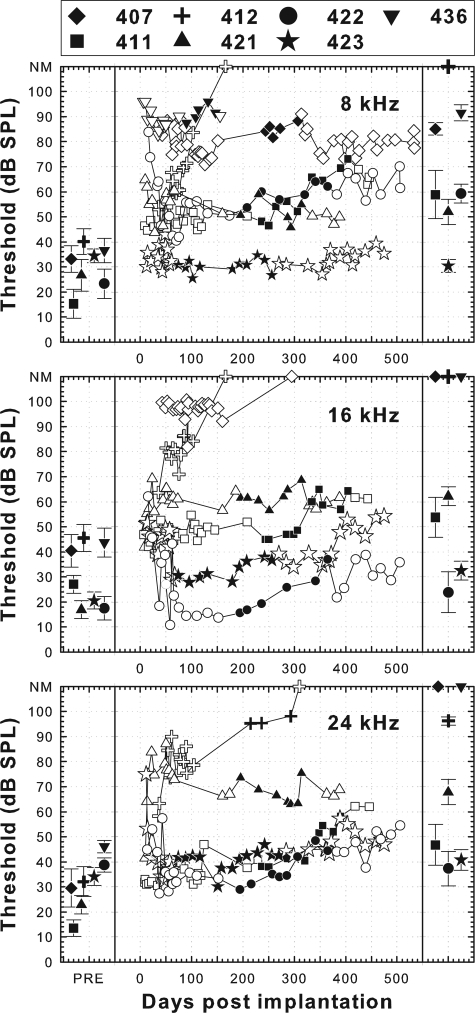
Figure 1.
Psychophysical pure-tone detection thresholds in the implanted ear prior to implantation, and as a function of time after implantation, for animals implanted in a hearing ear. The contralateral ear had been deafened with neomycin in all cases. The left column shows the mean and standard deviation of the last 10 thresholds collected before implantation. The middle column shows the thresholds as a function of time after implantation. Filled symbols in the middle column indicate acoustic thresholds measured during the time period when the electrical threshold versus pulse rate functions shown in Figs. 23 were being collected. The right-hand column shows the means and standard deviations of these values. Open symbols in the middle column indicate acoustic thresholds obtained before and after this period. NM indicates that thresholds could not be measured within the limits of our sound systems. Symbol shapes for these seven animals are maintained as filled black symbols through the remainder of the figures.

