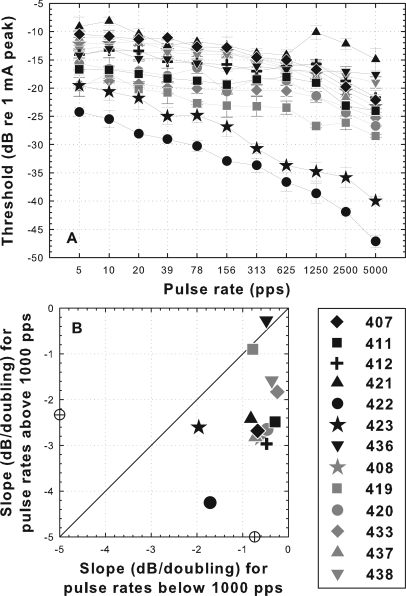
Figure 2.
Psychophysical electrical detection thresholds as a function of pulse rate for 200 ms electrical pulse trains for the 13 subjects from part I. Black symbols are for animals for which the implant was inserted in a hearing ear and gray symbols are for animals in which the ear was infused with neomycin prior to implantation. (A) Thresholds as a function of pulse rate. (B) Slopes of threshold versus pulse rate functions above 1000 pps versus slopes below 1000 pps. Slopes were calculated from linear best-fit regression lines. Points below the diagonal indicate that the slopes of the functions above 1000 pps were steeper (more negative) than slopes below 1000 pps. Mean slopes for all animals are indicated by open circles on the X and Y axes. Slopes above 1000 pps were significantly steeper than those below 1000 pps (t = 5.09, p < 0.0001). Symbols identifying each animal are given in the legend and are maintained throughout the manuscript.

