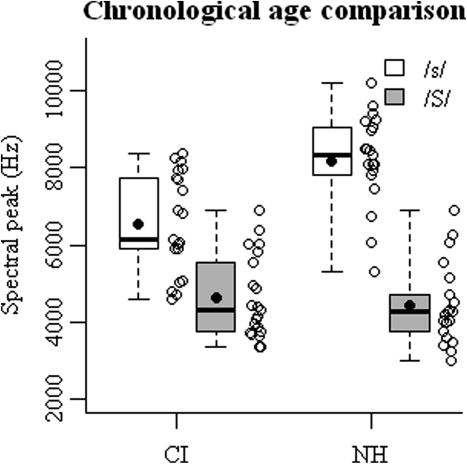
Figure 1.
Boxplots representing the range of the participants’ mean spectral peaks of productions of /s/ and /∫/ by the children with cochlear implants (CI; n = 21) and the normally hearing children (NH; n = 21) in the chronological age comparison group. Horizontal bars represent the median. Whiskers extend to the farthest data points. Data points are shown to the right of the box plots. Group means are shown by the black points.

