Figure 3.
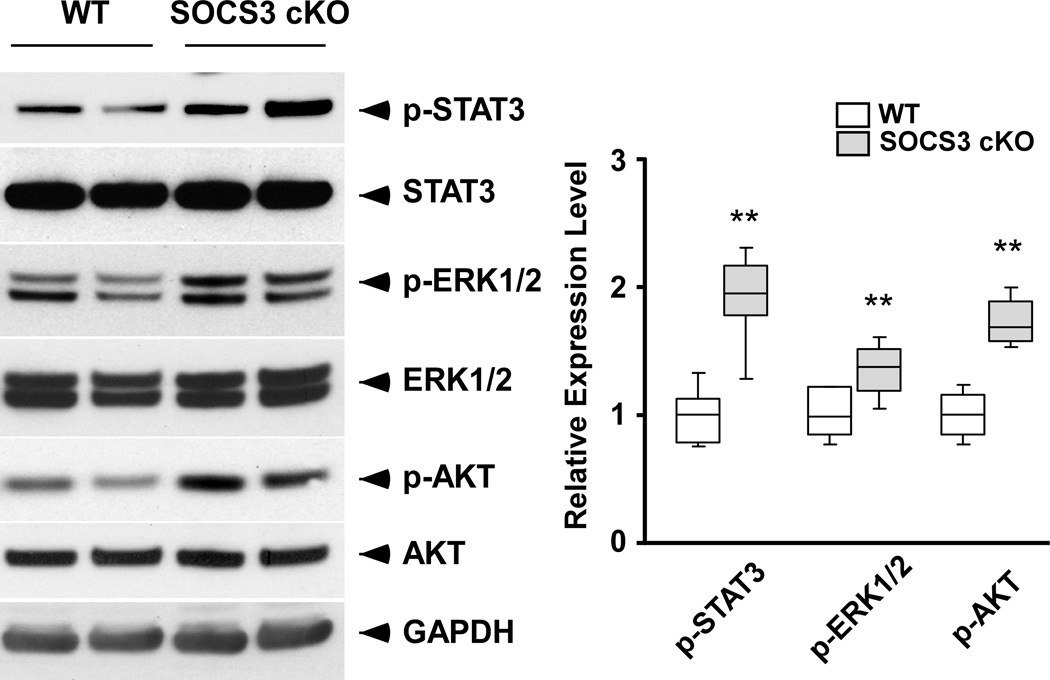
SOCS3 cKO mice developed cardiac dysfunction under acute pressure overload. A, Echocardiography before (Pre TAC) and 10 days after TAC (Post TAC) (8 weeks old, female, n=6 and 7, respectively). The changes in echo data before and after TAC were compared between the two groups using repeated measure ANOVA (*p<0.05). As a control, sham operated mice (n=5 in each group) were also examined at 10 days. PG; pressure gradient between right and left carotid arteries measured 10 days post TAC. LV/TL; LV weight and tibia length ratio. B, Activation of STAT3, ERK1/2 and AKT signaling in the heart 10 days after TAC. **p<0.05 comparing SOCS3 cKO with WT.


