
Figure 4.
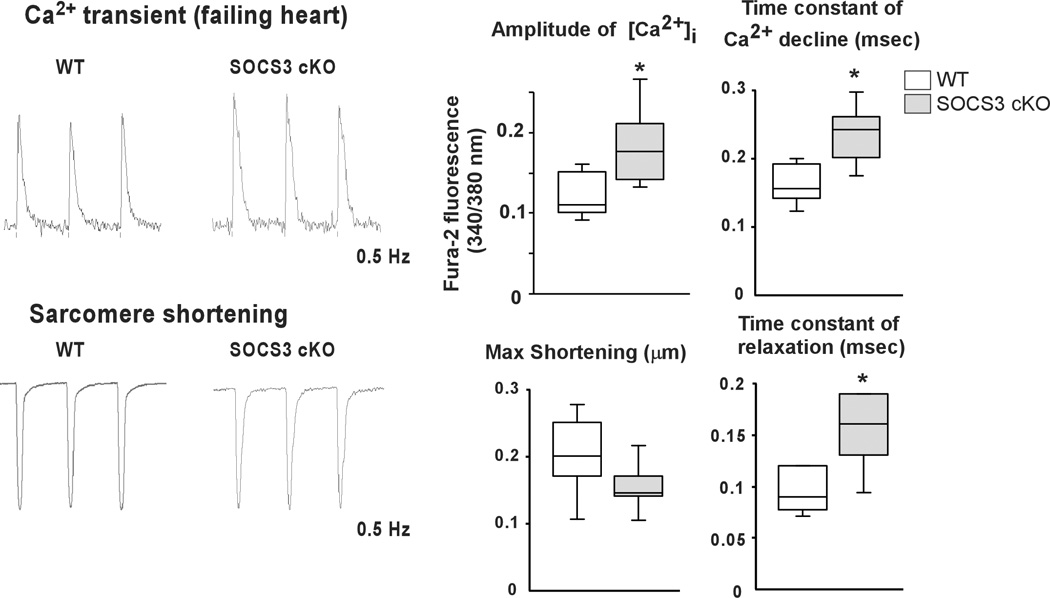
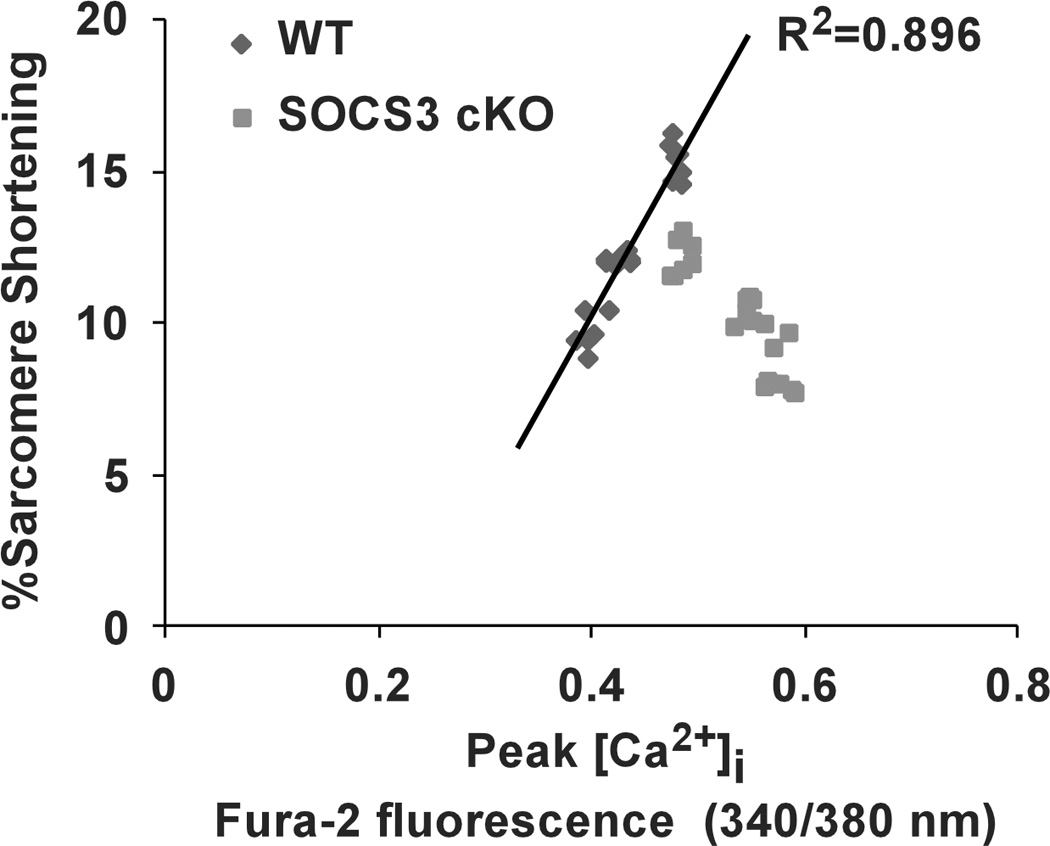

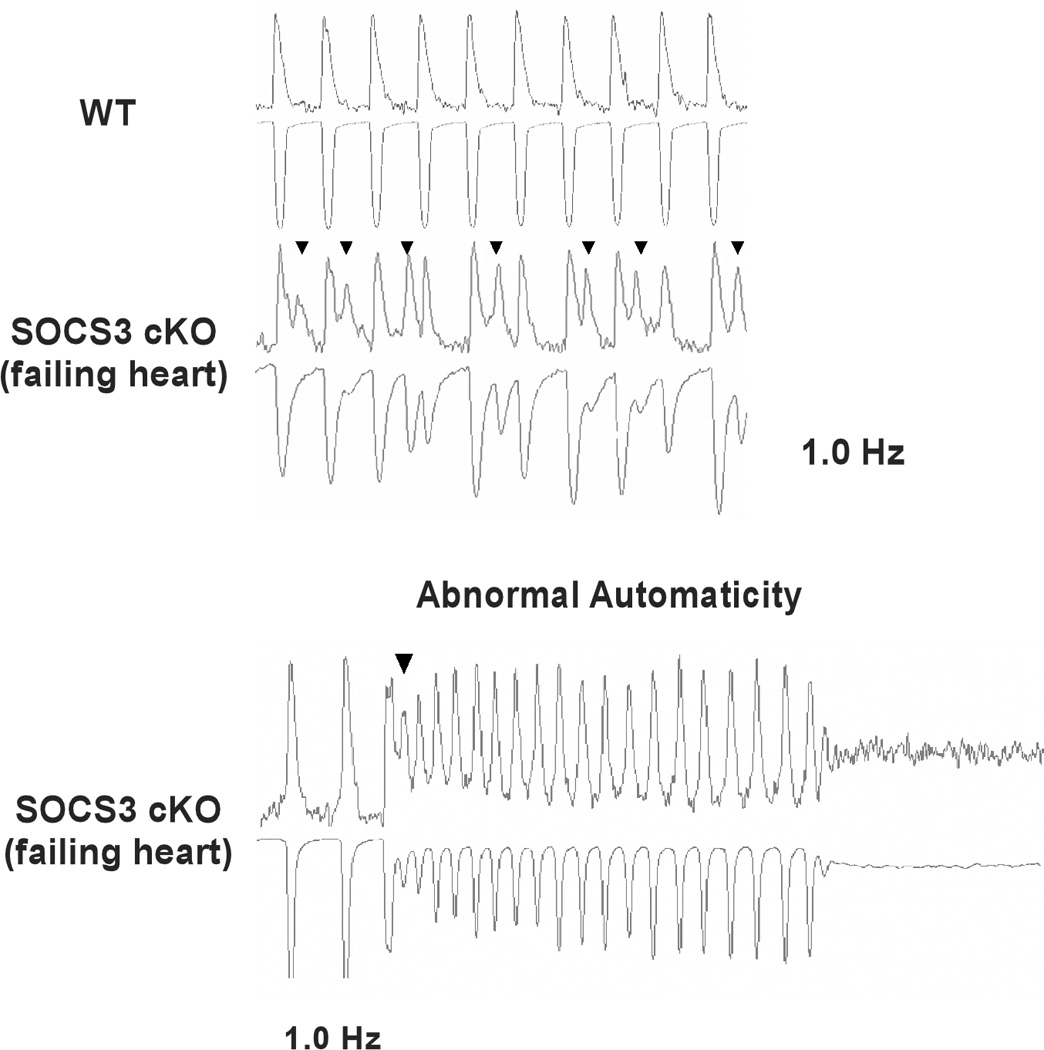
Increased Ca2+ transients and abnormal myofilament Ca2+ sensitivity in SOCS3 cKO mice. A, Ca2+ transient and sarcomere shortening measurements in SOCS3 cKO failing cardiomyocytes (28 week old). Cardiomyocytes were labeled with Fura-2 and voltage paced at 0.5 Hz. Representative recoding images for WT and SOCS3 cKO were shown on the left. Results for amplitude of [Ca2+]i, time constant of [Ca2+]i decline, max shortening, and time constant of relaxation are shown on the right. Representative recordings of 15 cardiomyocytes from three mice are shown. * p<0.05 comparing SOCS3 cKO with WT cardiomyocytes. B, The relationship between peak [Ca2+]i and %sarcomere shortening. Each dot represents each cardiomyocyte recorded. C, The expression level of SR proteins in SOCS3 cKO failing hearts. A representative western-blot from three independent experiments is shown. * p<0.05 comparing SOCS3 cKO with WT (n=5 in each group). D, Increased triggered activities in SOCS3 cKO failing cardiomyocytes. Cardiomyocytes were voltage paced at 1 Hz. Simultaneous recoding images of Ca2+ transient (top) and sarcomere shortening (bottom) are shown. Arrowheads show triggered activity. Short coupling of the triggered activity induced subsequent abnormal automaticity followed by fibrillation (bottom panel).