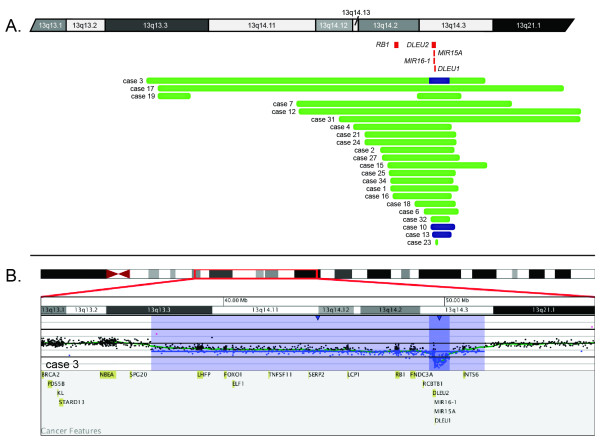
Figure 1.
Microdeletions of 13q14.3 detected by microarray analysis. (A) Green bars represent deletion sizes for each case (based on UCSC 2006 hg18 assembly). Cases 3, 10 and 13 had biallelic deletions, represented by navy blue bars. Red boxes represent genes of interest in the interval. (B) Microarray results for case 3. Microarray analysis showed biallelic deletion of MIR15A/MIR16-1, DLEU2, and DLEU1 (shaded in dark blue) and monoallelic deletion of RB1 (shaded in light blue). Probes are ordered on the x-axis according to physical mapping positions, with the most proximal 13q probes on the left and the most distal 13q probes on the right. Values along the y-axis represent log2 ratios of patient:control signal intensities. Results are visualized using Oncoglyphix (Signature Genomics).

