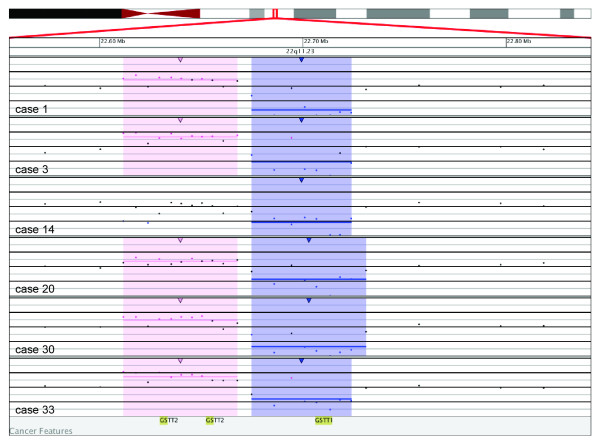
Figure 2.
Microarray results for six cases (cases 1, 3, 14, 20, 30 and 33) with a biallelic deletion at 22q11.23 of 49 to 56 kb that includes GSTT1. Probes are ordered on the x-axis according to physical mapping positions, with the most proximal 22q probes on the left and the most distal 22q probes on the right. Values along the y-axis represent log2 ratios of patient:control signal intensities. Results are visualized using Oncoglyphix (Signature Genomics).

