
Figure 3.
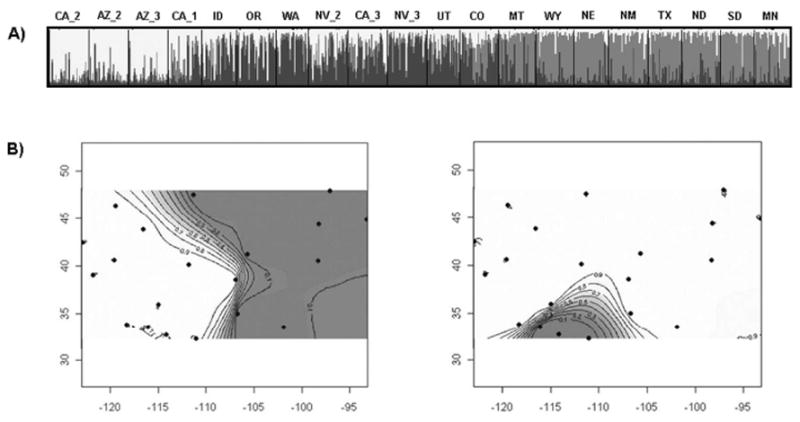
Bayesian population structure analyses indicating the presence of three population clusters. A) Plot from highest log likelihood STRUCTURE run at K = 3. Individuals are grouped by collection site. Each individual is represented by a vertical bar displaying membership coefficients to each of three clusters, depicted as white, gray and black. Cluster numbers correspond closely to those resolved in phylogenetic analysis (Figure 3). B) and C) Maps of posterior probabilities per pixel at K = 2 clusters in GENELAND. B) Modal clustering pattern resolved in 8 of 10 runs. Mean log likelihood = -19487. C) Clustering pattern resolved in 2 of 10 runs. Mean log likelihood = -19803.