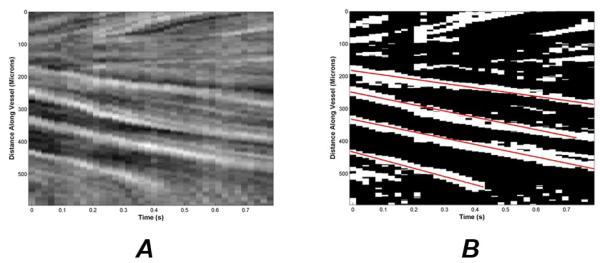
Figure 3.
A) A space time image generated for the blood vessel V2 outlined in Fig 2B. The vertical and horizontal axes represent vessel path length and frame time, respectively; B) The best fit line to each continuous band on the binarized space time image is displayed. The line slope is a measure of axial blood velocity.

