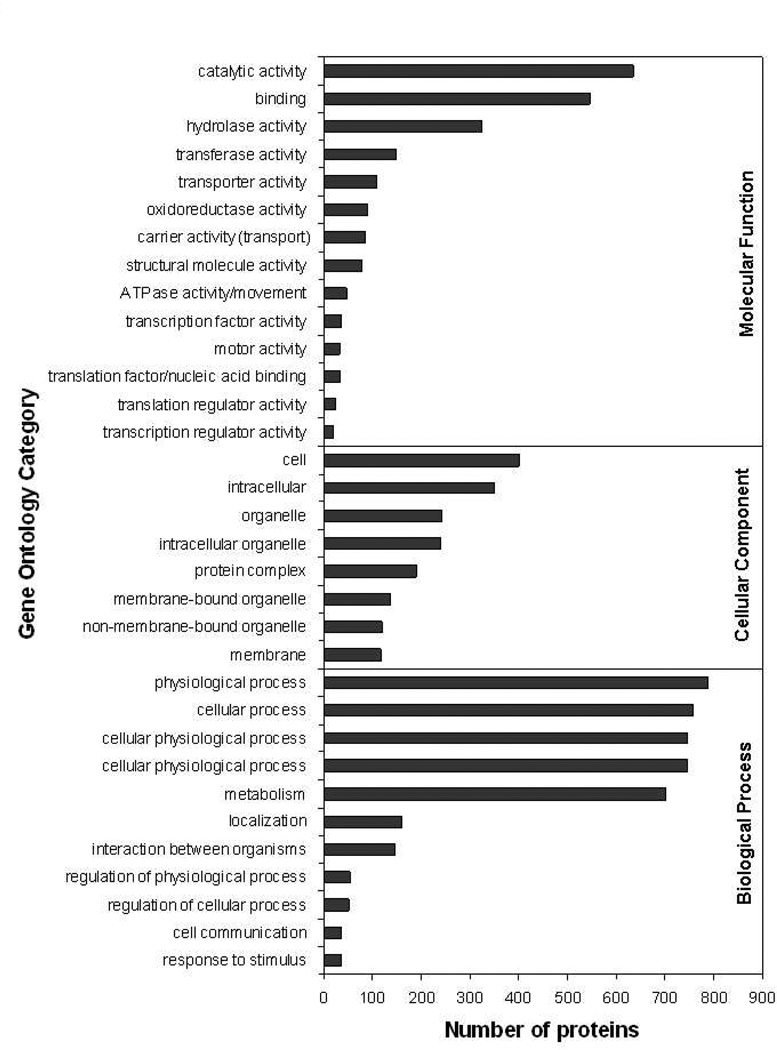
Figure 3.
Gene Ontology analysis. GO analysis was performed using GOblet algorithm. Selected representative categories for “molecular function”, “cellular component”, and “biological process” are shown in the graph. For the complete list, see Table S4.

