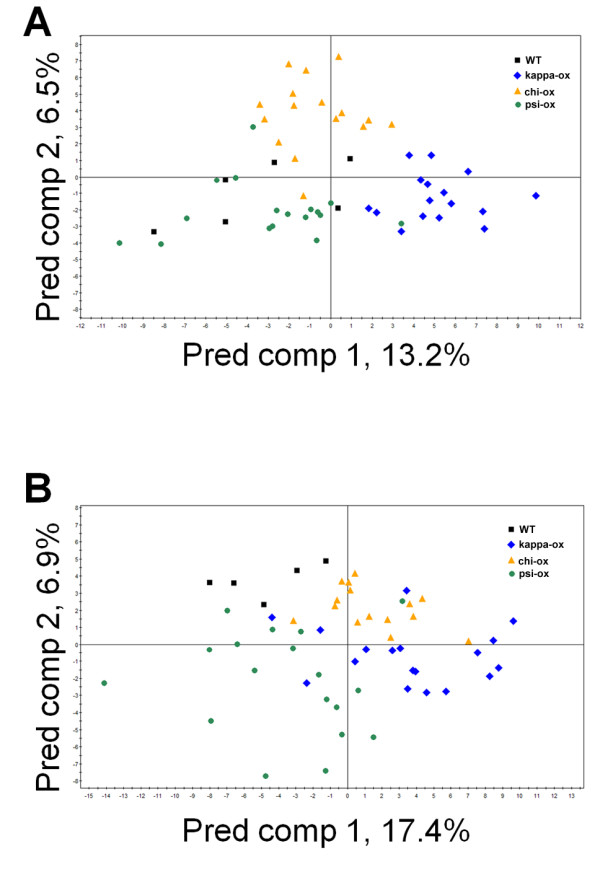
Figure 1.

The OPLS-DA score scatter plots of three 14-3-3 overexpressing and wild type samples for (A) shoots and (B) roots. Each point represents an independent plant sample in the score scatter plots. We used 55 shoots and 56 roots for the analysis. (A) The OPLS-DA model for shoot samples shows three significant components, with R2X, R2Y and Q2Y values of 0.37, 0.67 and 0.41, respectively. (B) The OPLS-DA model for root samples shows three significant components, with R2X, R2Y and Q2Y values of 0.30, 0.50 and 0.23, respectively. Black square, wild type; blue diamond, kappa-ox; yellow triangle, chi-ox; green circle, psi-ox.
