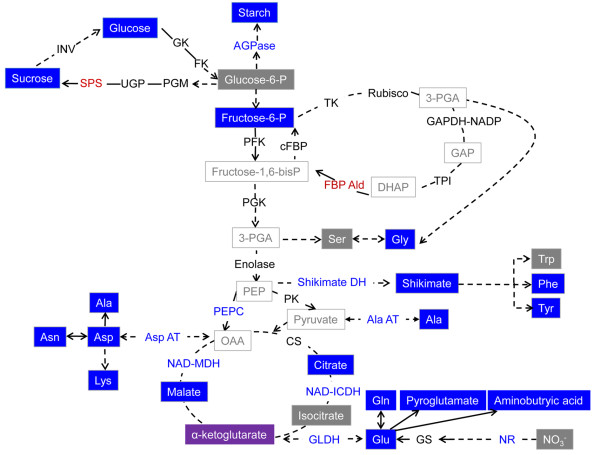
Figure 6.
The schematic model of metabolic pathways that are regulated by 14-3-3 proteins. Grey box indicates unchanged metabolites; blue box indicates decreased metabolites in 14-3-3 overepxression plants compared to wild type plants; no colored box indicates that metabolites were not measured in this study; purple box (α-ketoglutarate) indicates that some overexpression lines showed higher level of metabolite compared to WT but others showed lower than WT. Black letters indicate that the activities of enzymes were unchanged in 14-3-3 overexpression plants compared to WT; Blue letters indicate that the enzyme's activity was decreased in 14-3-3 overexpression plants; Red letters indicate that the enzyme's activity was increased in 14-3-3 overexpression plants. AGPase, Glucose-1-phosphate adenylyltransferase; INV, β-fructofuranosidase; SPS, sucrose-phosphate synthase; UGP, UTP-glucose-1-phosphate uridylyltransferase; PGM, Phosphoglucomutase; PFK, 6-phosphofructokinase; cFBP, Fructose-bisphosphatase; TK, Transketolase; GAPDH-NADP, Glyceraldehyde-3-phosphate dehydrogenase (NADP+) (phosphorylating); TPI, Triose-phosphate isomerase; FBP Ald, Fructose-bisphosphate aldolase; PFK, 6-phosphofructokinase; PEPC, Phosphoenolpyruvate carboxylase; PK, Pyruvate kinase; Shikimate DH, Shikimate dehydrogenase; Ala AT, Alanine-glyoxylate transaminase; CS, Citrate synthase; NAD-ICDH, Isocitrate dehydrogenase (NAD+); NAD-MDH, Malate dehydrogenase; GLDH, Glutamate dehydrogenase; NR, Nitrate reductase; ASP AT, Aspartate transaminase.

