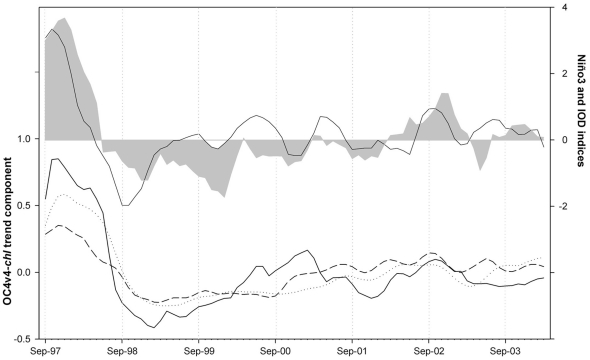
Figure 3. Interannual bio-optical variability in Lake Victoria for 1997–2004 and global indices of interannual climate fluctuations.
Trend components extracted from the OC4v4-chl series (bottom). North Region, solid line; Transitional Region, dotted line; South Region, dashed line. Indices of interannual climate variability linked to ENSO (shaded area) and IOD (solid line) phenomenon (top). Linear correlations between trend components and climate indices were statistically significant at the 99% confidence level for all the combinations (R>0.840, p<0.001, n = 79).

