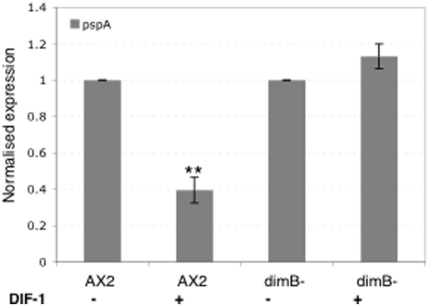
Figure 5. DIF repression of pspA expression.
Disaggregated cells at the mound stage were incubated in the presence or absence of DIF-1. Q-PCR analysis of RNA samples was performed and the data is plotted as the mean of 3 independent biological repeats each performed in triplicate. The data is normalized to the expression level of Ig7, a constitutively expressed gene and that for each strain is normalized to the value without DIF. The mean results are shown with their standard deviations.

