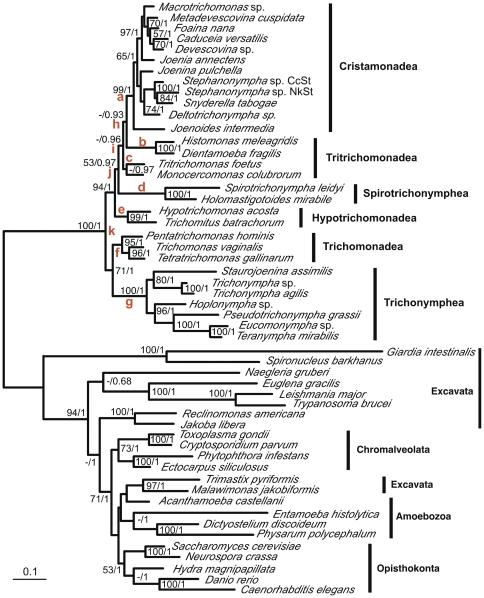
Figure 3. Maximum likelihood tree based on concatenation of actin, EF-1α, and SSU rRNA gene sequences and rooted by diverse eukaryotes.
Unambiguously aligned amino acid sites of actin (268) and EF-1α (274), and nucleotide sites of SSU rRNA (1265) gene sequences were concatenated and analyzed in 30 parabasalian species and 23 diverse eukaryotes as outgroups. The tree was estimated with RAxML using the CAT model (CATMIX). The parameters and branch length were optimized for each gene partition individually. The supporting values (bootstrap in RAxML/Bayesian posterior probability) are indicated at the nodes. Values below 50% or 0.5 are indicated with hyphens. Vertical bars to the right of the tree represent the parabasalian classes. The 11 possible root positions are indicated in red letters. The scale bar corresponds to 0.10 substitutions per site.

