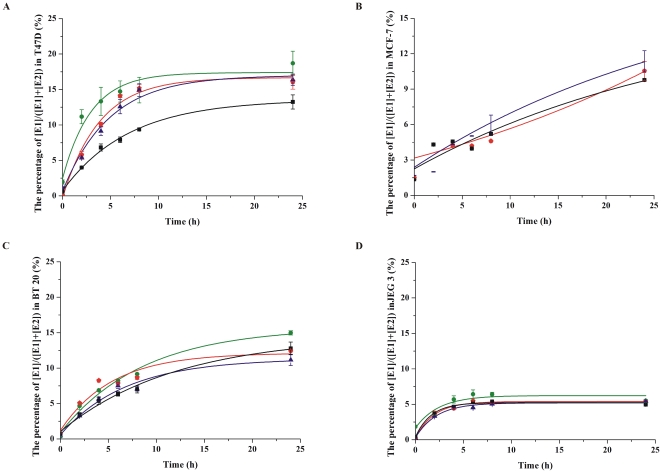
Figure 2. The conversion of E2 to E1 in T47D, MCF-7, BT 20 and JEG 3 cells.
50,000 cells were plated onto 24-well plates, and different concentrations of E2 (0.01 µM, 0.05 µM, 0.1 µM and 0.3 µM) were added to dextran-coated charcoal treated medium. E1 production was evaluated at 0 h, 2 h, 4 h, 6 h, 8 h and 24 h. Choosing 0.01 µM, 0.05 µM, 0.1 µM and 0.3 µM E2 as the substrate are represented by green, red, blue and black lines respectively. Experiments were performed in duplicate, and all the data are fit to sigmoidal or exponential distribution (S.D.≤1%).

