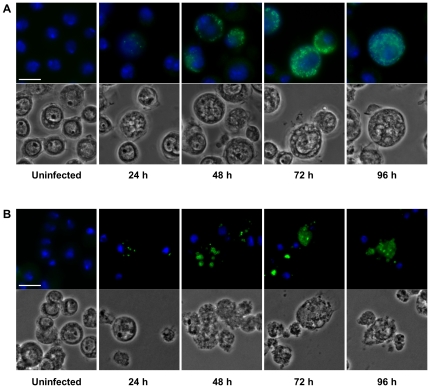
Figure 2. Infection cycle of S. negevensis (A) and Pa. acanthamoebae (B) in S2 cells.
S2 cells were either left untreated or were infected with S. negevensis (MOI 5) (A) or Pa. acanthamoebae (MOI 0.5) (B). At indicated time points, bacteria were visualized by immunostaining (green) using antibodies raised against the protochlamydial heat-shock protein DnaK (A) or purified Pa. acanthamoebae UV7 (B). DNA was stained with DAPI (blue). The bar corresponds to 10 µm.

