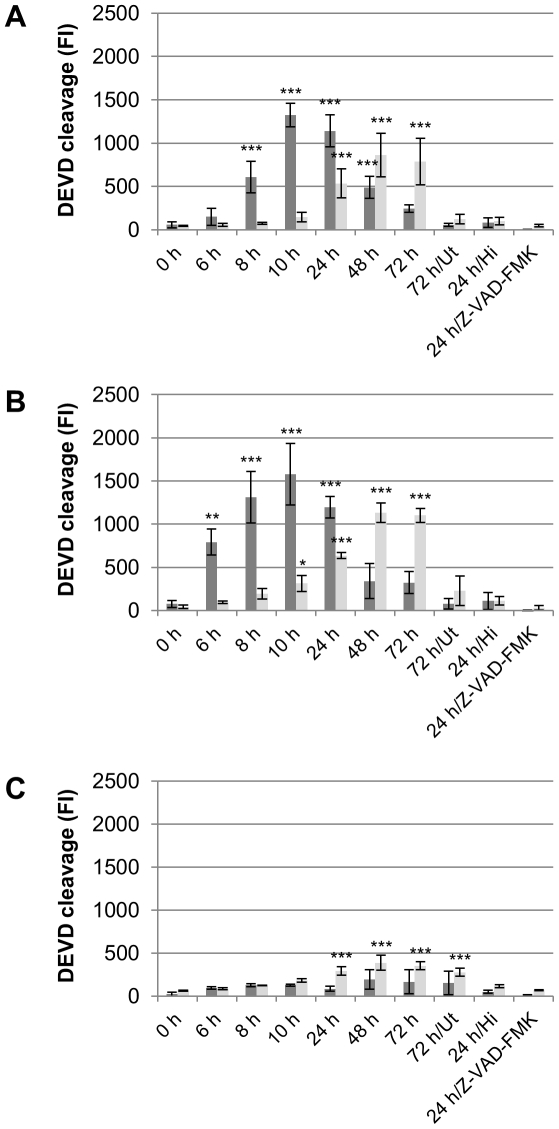
Figure 4. Time course of Parachlamydiaceae-induced effector caspase activity in S2 cells.
S2 cells were infected with Pa. acanthamoebae (A), P. amoebophila (B), or S. negevensis (C) at a MOI of 5. Untreated cells (Ut) and cells treated with heat-inactivated bacteria (Hi) or with infectious bacteria in the presence of the pan caspase inhibitor Z-VAD-FMK (10 µM) served as controls. Activity of effector caspases in cell lysates (dark gray) and culture supernatants (light gray) was measured at indicated time points by application of an in vitro DEVD cleavage assay, in which substrate cleavage results in an increase in fluorescence intensity (FI). Mean values and standard deviations of four replicates are shown. Statistical significant differences compared to 0 h p.i. are indicated (ANOVA & Scheffé ; ***, p≤0.001; **, p≤0.01; *, p≤0.05). ActD-treated cells (14 h) were used as additional positive control for the assay and resulted in mean fluorescence intensities of 3261 and 658 (standard deviation 1010 and 473) in cell lysates and supernatants, respectively.

