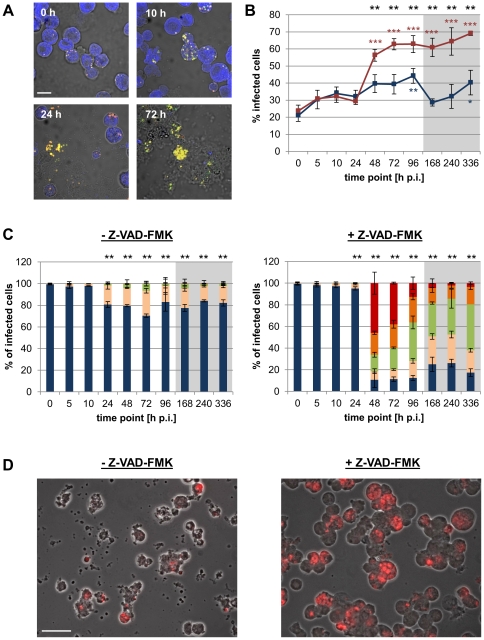
Figure 7. Effect of caspase inhibition on the infection of S2 cells with Pa. acanthamoebae.
S2 cells were infected with Pa. acanthamoebae (MOI 5) and were incubated for the indicated time periods in the absence or presence of the pan caspase inhibitor Z-VAD-FMK (10 µM). Bacteria were detected with the FISH probes UV7-763 (Cy3, red) and Chls-0523 (Fluos, green), host cells with the probe EUK516 (Cy5, blue). Representative confocal images of the infection cycle (in the absence of Z-VAD-FMK) are shown in (A). The bar indicates 10 µm. The percentage of infected cells observed in the absence (blue) or presence (red) of Z-VAD-FMK over the course of infection is depicted in (B). Black stars indicate statistically significant differences between both curves (t-test) and colored stars indicate significant differences to the respective 0 h p.i. time point (ANOVA & Scheffé). Numbers of intracellular bacteria per infected cell were determined and are shown in (C). Infected cells were classified into 5 groups according to the number of intracellular bacteria (1–3, blue; 4–10, rose; 11–30, green; 31–100, orange; >100, red). Stars indicate statistically different distributions among these classes at a given time point between infections carried out in the absence or presence of Z-VAD-FMK (χ2 test). In (B) and (C) mean values and standard deviations of three replicates are shown (***, p≤0.001; **, p≤0.01; *, p≤0.05). The gray boxes indicate time points that were analyzed after cells had been passaged. The microscopic images in (D) illustrate the enhanced infection of S2 cells with Pa. acanthamoebae in presence of Z-VAD-FMK at 48 h p.i. Bacteria were detected with the FISH probe UV7-763 (Cy3, red). The bar corresponds to 20 µm.

