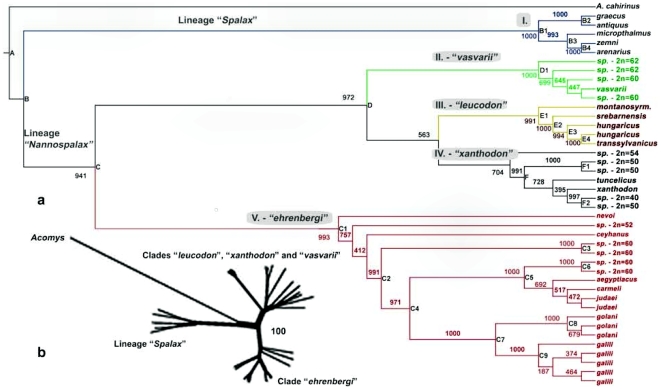
Figure 1. Maximum likelihood phylogenetic tree showing the relationship between 41 samples of blind mole rats plus one outgroup Acomys cahirinus.
Numerical values represent bootstrap values out of 1000 reiterations. The nodes marked by capital letters represent internal and external branches supported by bootstrap values higher than 95%. The clades are referred to by Roman numerals: I “Spalax”, II “vasvarii”, III “leucodon”, IV “xanthodon” and V “ehrenbergi” (a). Taxonomic nomenclature is according to Table S1; Neighbour-net graph showing an agreement in the major splits with the ML tree (b).

