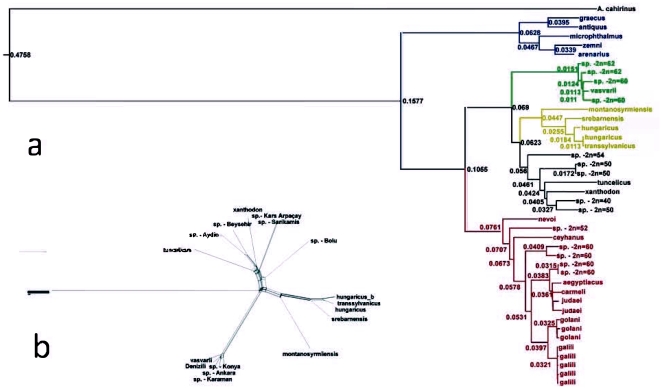
Figure 2. Maximum likelihood phylogram of blind mole rates constructed by means of PhyMl.
Branch values indicate the rate of heterogeneity (a). Neighbor-net graph showing relationship between clades “vasvarii”, “leucodon” and “xanthodon”. It shows that the clades are significantly separated (indicated by 100% bootstrap), but that among them some speciation-related processes such as hybridization or introgression could take place (b).

