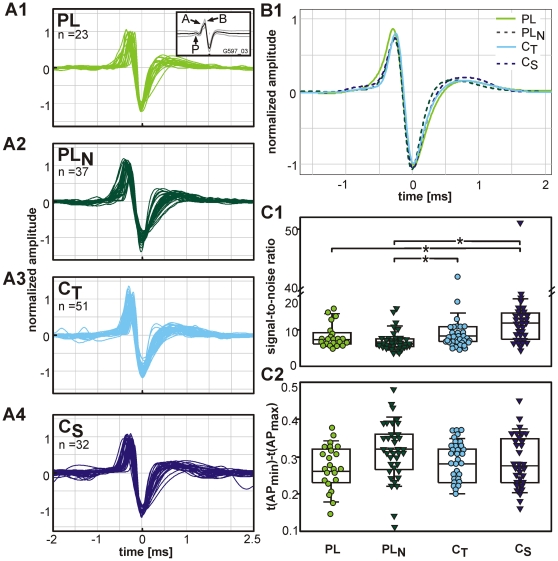
Figure 3. Waveform analysis.
A1–A4: Averaged and normalized waveforms of single units sorted according to their PSTH types (numbers of units indicated in the graphs). The inset in A1 shows the mean waveform of the action potentials (black line, grey lines: S.D.) of a PL unit displaying the presynaptic component P and the two postsynaptic components ‘A’ and ‘B’. B1: Normalized average waveforms of all units of the respective PSTH types. C1: Signal-to-noise ratio and C2: duration from the maximum to the minimum of the waveforms of the respective PSTH types. Each symbol represents the value of a single AVCN unit. Significant differences (p≤0.05) between PSTH types are indicated with asterisks.

