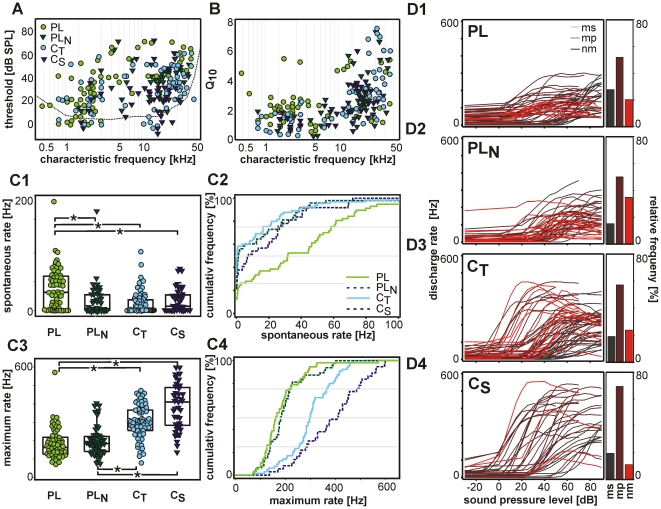
Figure 4. Tuning characteristics and spontaneous activity.
A: Distribution of characteristic frequencies and threshold values for units of different PSTH type (dotted line: behavioural audiogram of the Mongolian gerbil, Ryan 1976). B: Frequency selectivity of the units quantified by Q10-values (symbols as in A). C1 and C3: Distribution and C2 and C4: cumulative frequency of the spontaneous (C1 and C2) and of the maximum (C3 and C4) discharge rates of the respective PSTH types. Note that PL units have the highest spontaneous but low maximum discharge rates. Highest discharge rates were observed in CS units. D1–D4: Rate-level functions of the units of different PSTH types. The histograms on the right side of each graph show the fraction the different rate-level function types: steady monotonic (ms), monotonic with plateau (mp), non-monotonic (nm). Note that all types of rate-level functions have their share in the different PSTH groups.

