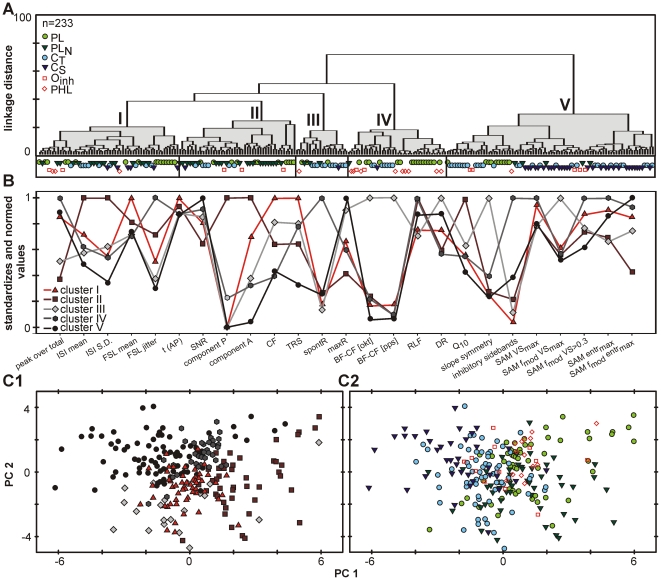
Figure 6. Cluster analyses considering all evaluated response properties.
A: Dendrogram illustrating the result of hierarchical cluster analysis. The units (n = 233) are lined up at the bottom of the graph. The analysis suggests five clusters characterized by a specific distribution of parameter values. B: Mean of the respective parameter values for each property in the resulted clusters I–V. The values are standardized and normalized to the respective maxima (for original data and statistical analyses see table 2). Note that for almost all individual properties significant differences exist between the clusters, and some properties also correlated across clusters. C: However, principal component analysis gives no indication for clearly separated groups of units, neither for the different clusters gathered from hierarchical cluster analysis (C1) nor for the different PSTH types (C2). In both cases units establishing different groups tend to accumulate in different regions of the plot. Still, the different groups strongly overlap, especially in the centre of the plot. Thus, with respect to their physiological properties the AVCN neurons form a continuum rather than distinct groups.

