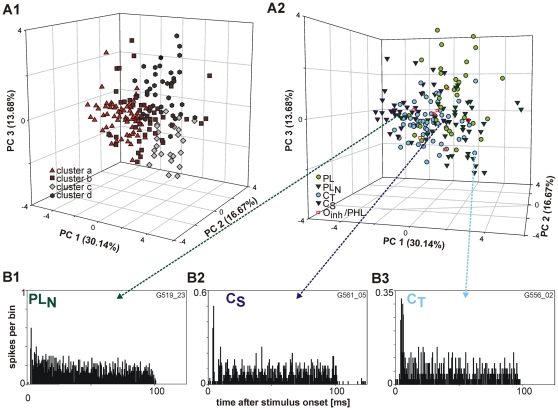
Figure 8. Principal component analysis employing three principal components and recheck of PSTH classification.
Same sample of units (n = 174) and analysis as in figure 7. A1: Principal component analysis with assignment of the units to the different clusters gathered from hierarchical cluster analysis. A2: Principal component analysis with assignment of the units to the different PSTH types. Note that even a visualization based on the three dominant principal components does not indicate a clear separation of unit types. B: PSTHs of units in regions of the plot which are mainly occupied by other PSTH types, i.e. a PLN (B1), a CS (B2) and a unit which is not unambiguously to classify (B3). This unit was classified as CT, but it could also be a PL.

