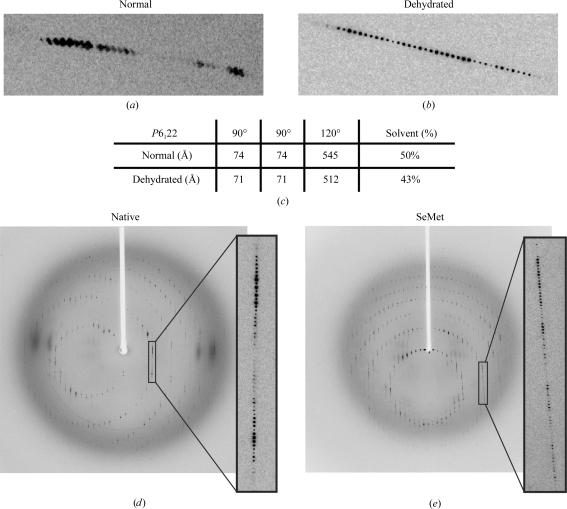
Figure 3.
Comparison of diffraction patterns before and after dehydration. (a) Diffraction pattern prior to dehydration and (b) that after dehydration. Dehydration results in reflections that are sharpened significantly with clear separation between intensities. (c) Unit-cell volume before and after dehydration. A significant reduction in unit-cell volume is observed on dehydration. This results in a 6.6% decrease in solvent content. (d, e) Full-frame diffraction images of native and SeMet diamond-shaped crystals after dehydration. Native data were collected at a wavelength of 1.03 Å with a crystal-to-detector distance of 320 mm, an oscillation range of 0.8° and a mosaicity of 0.26°. SeMet data were collected at three wavelengths corresponding to the low remote, inflection and the high remote with a crystal-to-detector distance of 380 mm, an oscillation range of 1° and a mosaicity ranging from 0.415° to 0.48°.

