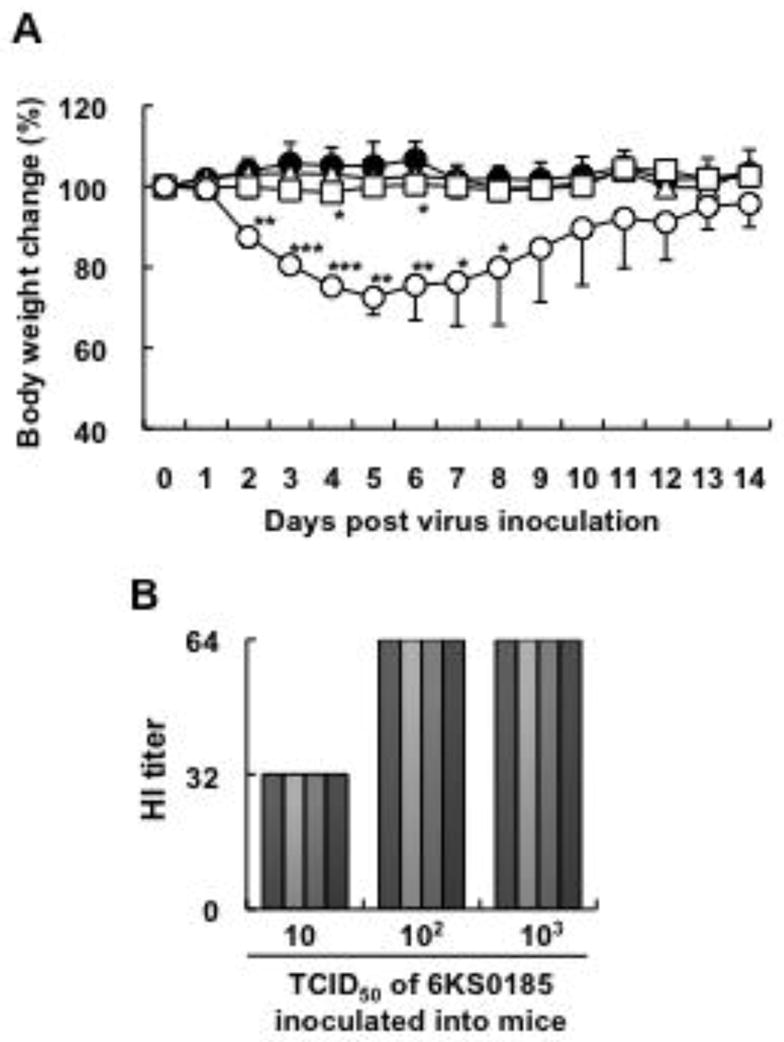
Fig. 3.

The mouse infection study of the H4N8 isolate 6KS0185 (n = 4). (A) Body weight changes in the mice that were intranasally inoculated with 103 (○), 102 (□), and 10 (△) TCID50 of 6KS0185. Control mice (●) received the same amount of PBS. The results are presented as mean ± S.D. Asterisks represent significant differences between the control and experimental groups. *p < 0.05, **p < 0.001, ***p < 0.0001 by Student’s t-test. (B) HI titers of the sera obtained from the mice inoculated with 6KS0185 on 14 dpi. Each column represents the HI titer of a mouse that received 6KS0185, and that of a control mouse receiving PBS.
