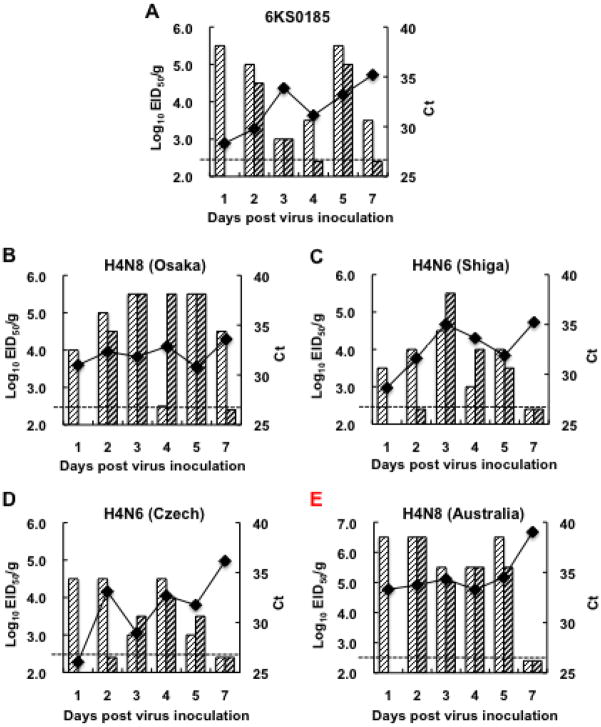
Fig. 6.
Virus titers (EID50) and Ct values in RRT-PCR analysis of the viral M gene for the lungs obtained from the mice inoculated with the H4N8 isolate and the reference viruses. The mice were euthanized on the indicated days after inoculation (103 TCID50) with 6KS0185 (A), A/duck/Osaka/1/05 (B), A/duck/Shiga/8/04 (C), A/duck/Czechoslovakia/56 (D) or A/red-necked-stint/Australia/1/04 (E). Each column represents a virus titer of 1 mouse and the broken line indicates the threshold level for virus detection. The line graph presents the average of the Ct values in the RRT-PCR.

