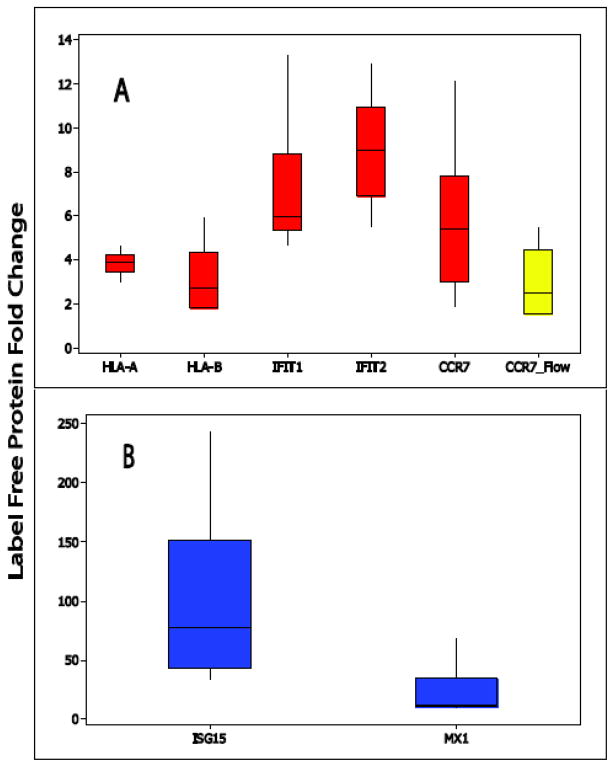
Figure 3.
Box-Whiskers plots of fold change for selected immune related proteins across all samples analyzed in both studies. Panel A highlights proteins with an average fold change of <10 and panel B highlights protein with >15 fold change (stimulated versus non-stimulated). The yellow box-whisker plot highlights flow cytometry fold change (stimulated versus non-stimulated) for a selected protein, CCR-7.

