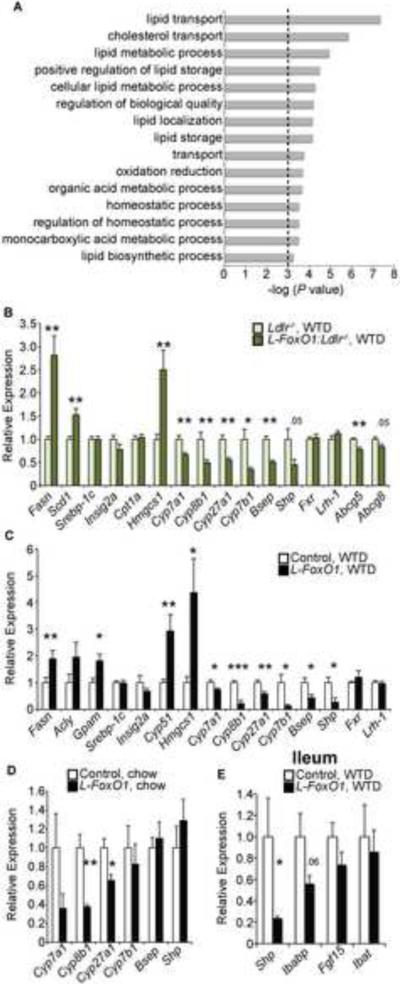
Figure 3. Gene expression changes due to hepatic FoxO1 ablation.
(A) Gene ontology enrichment analysis, based on microarrays of liver tissue from WTD-fed L-FoxO1 and L-FoxO1:Ldlr−/− versus littermate controls. Only non-redundant pathways, where P< 0.001 for the pathway, are shown. (B–D) Relative hepatic gene expression by qPCR in (B) WTD-fed L-FoxO:Ldlr−/−, (C) WTD-fed L-FoxO1, and (D) chow-fed L-FoxO1 mice. (E) Relative gene expression by qPCR in ileum from WTD-fed L-FoxO1 mice. (n=6–7 for all) *P <0.05, **P < 0.01, ***P < 0.001, by Student's t-tests. Data are presented as mean ± S.E.M.

