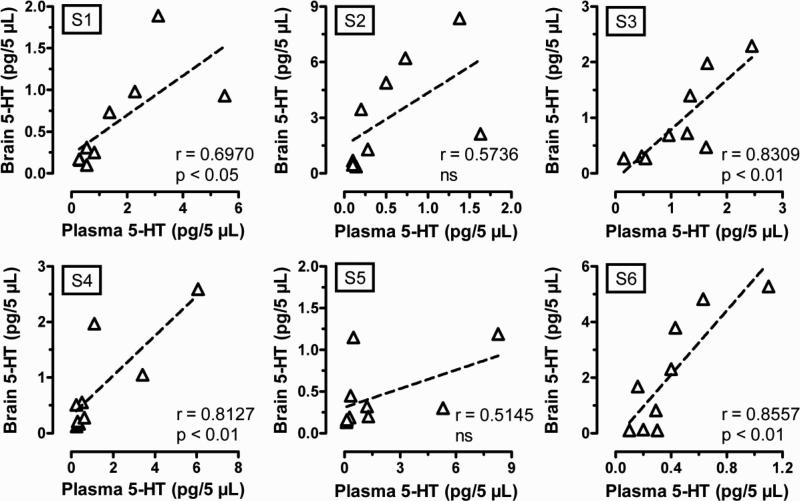
Figure 5.
Correlation between brain and blood 5-HT levels obtained after MDMA administration for each individual rat tested. MDMA was dissolved in sterile saline, and 0.3 mg/kg i.v. was given at 0 min followed by 1.0 mg/kg i.v. at 60 min. Serial samples from blood and brain were withdrawn at 20-min intervals and were immediately dialyzed as described under Materials and Methods. The data show effects determined before and after injections, and are expressed as pg/5 μL values. Pearson's correlation coefficient “r” and P value are given for the data from each individual rat.

