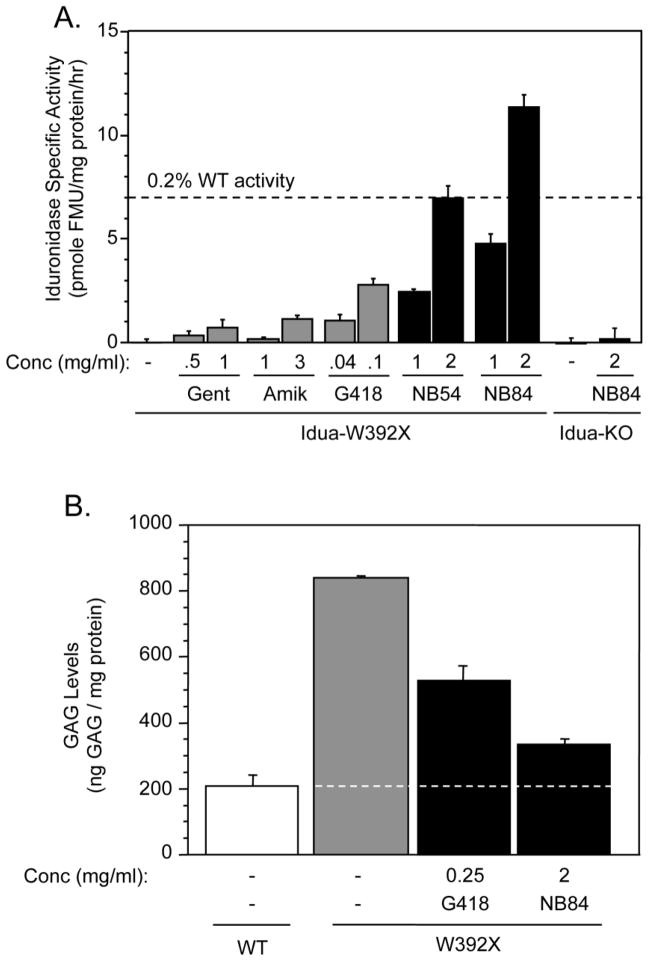
Figure 3. Evaluation of Idua-W392X suppression using MEFs.
(A) α-L-iduronidase specific activity in Idua-W392X MEFs cultured +/− varying concentrations of conventional and designer aminoglycosides. The dashed line indicates the α-L-iduronidase specific activity value that is 0.2% of WT as reference. The data shown is expressed as the mean +/− SD of at least six replicates. (B) Sulfated GAG quantitation in wild-type MEFs (WT) and Idua-W392X MEFs (W392X) cultured in the absence or presence of G418 or NB84. The dashed line represents the WT GAG level as a reference to compare with the GAG levels in the Idua-W392X MEFs. The data shown is representative data expressed as the mean +/− SD of at least three replicates.

