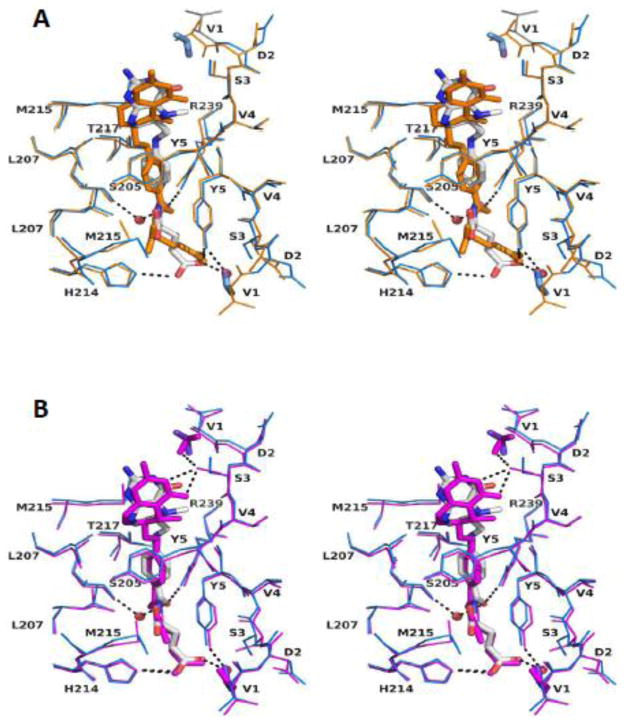
Figure 3. A stereo figure of superposition of the folate binding sites.
A: Rat liver GNMT-folate monoglutamate (blue) and recombinant GNMT-folate monoglutamate (orange) complexes.
B: Rat liver GNMT-folate monoglutamate (blue) and rat liver GNMT-folate pentaglutamate (magenta) complexes. N-terminal acetyl groups are shown in stick representation. Only one folate binding site (site A) is shown.

