Figure 1.
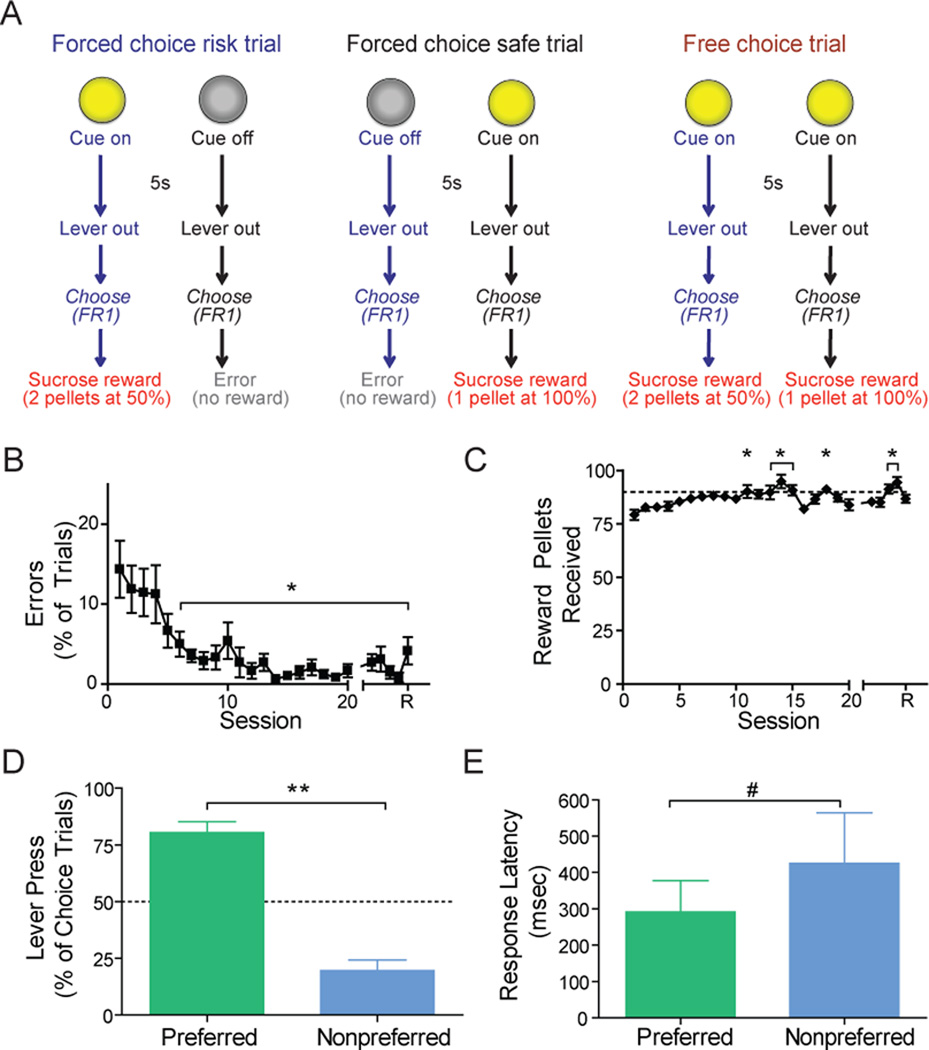
Individual differences in risky decision making behavior. (A) Schematic representing task (see main text for description). (B) A significant reduction in percentage of errors and (C) a significant increase in reward pellets received across sessions compared to session 1. For B and C the behavioral data following surgery consisted of the final 4 days before the recording session (represented by R). (D) Response allocation on free-choice trials averaged across the final two training sessions and recording session. Dashed lines represent indifference point. Each animal showed a significant preference for one (safe or risk) option and (E) a trend toward decreased response latency for the preferred versus nonpreferred lever. All data are mean ± SEM. *P<0.05; **P<0.0001; #P=0.1.

