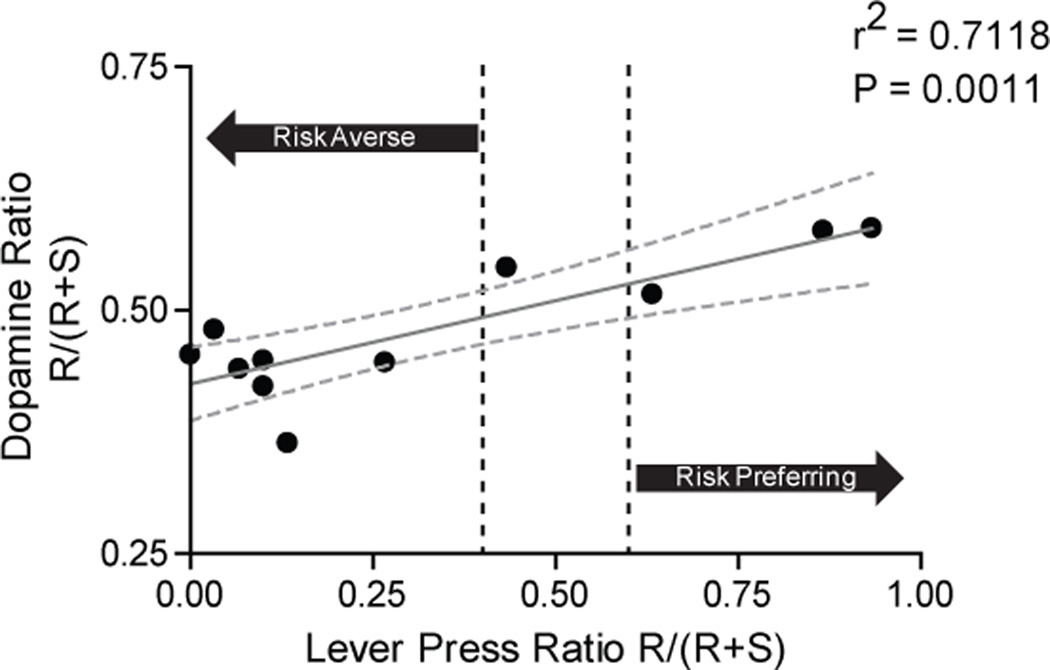
Figure 3.
DA signaling correlates with lever press behavior for risk versus safe options. The x-axis is lever press behavior during free choice trials showing the risk preference of each animal. Dotted lines indicate the criteria for a significant preference (defined as pressing the preferred lever 60% of the time). The ratio of lever pressing was determined by dividing the number of presses on the risk lever during free-choice trials by the total number of presses on free-choice trials (Risk/(Risk+Safe)). A ratio greater than 0.6 indicates that an animal is risk-prone while a ratio of less than 0.4 indicates an animal is risk-averse. Area in between the dotted lines indicate no preference. The y-axis is the ratio of DA signaling for forced-choice risk and forced-choice safe trials. This ratio was calculated by taking the peak DA concentration within 2s of the cue presentation for risk and safe trials using the same formula as above (Risk/Risk+Safe). A ratio higher than 0.5 means that an animal had greater DA signaling during the risk cue compared to the safe cue while a ratio of less than 0.5 means that an animal had less DA signaling to the risk cue than the safe cue.

