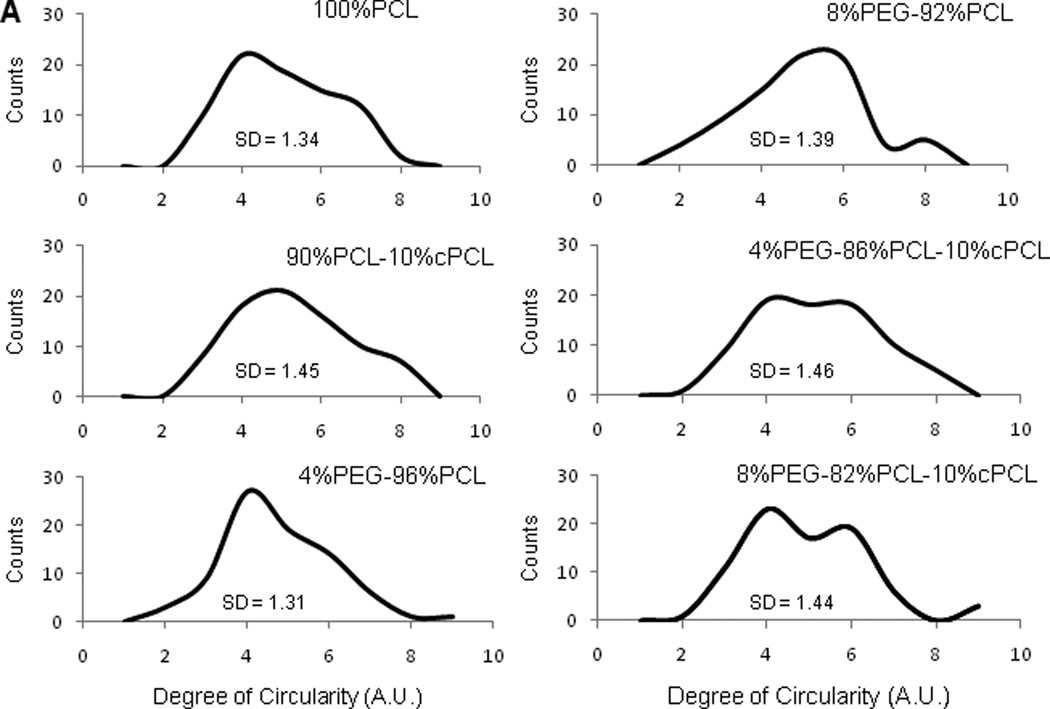
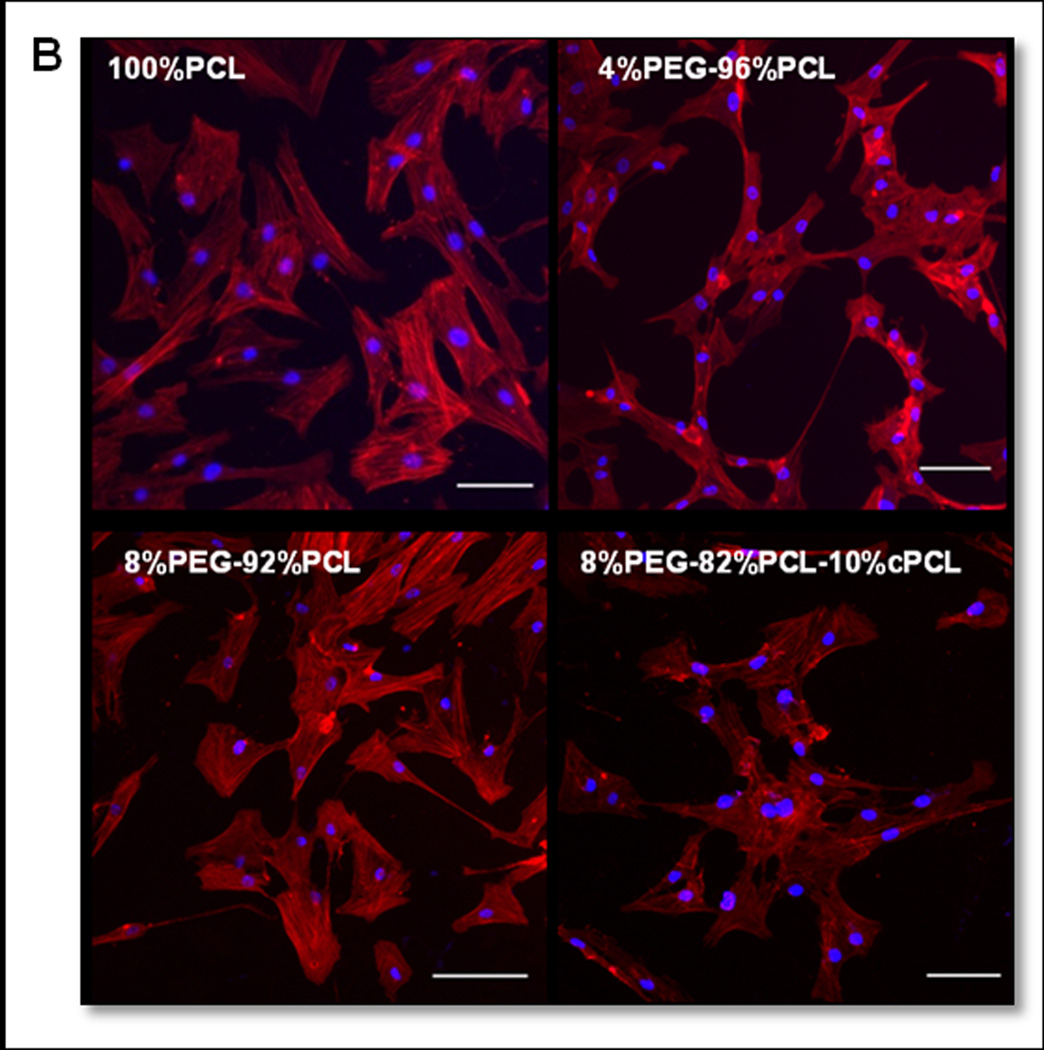
Figure 5. HCASMCs morphology.
(A) Histograms of circularity distribution for HCASMCs grown on test substrates for three days (n = 80). Degree of circularity ranges from 0 (elongated) to 10 (perfect circle). SD = standard deviation of cell circularity for each polymer type. (B) Fluorescence images of HCASMCs stained with phalloidin (red) and Hoechst (blue) on four different polymer types. Scale bars = 100 µm.


