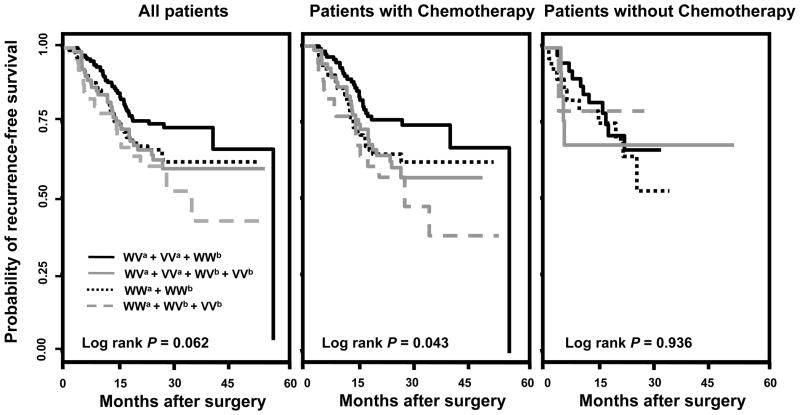
Figure 2.
Kaplan-Meier recurrence-free survival curves of joint effects between rs6505162 and rs4919510 under a dominant model. WWa + WVb + VVb indicate the combination of the low-risk genotypes of both rs6505162 and rs4919510; WVa + VVa + WVb + VVb indicate the combination of the high-risk genotypes of rs6505162 and the low-risk genotypes of rs4919510; WWa + WWb indicate the combination of the low-risk genotypes of rs6505162 and the high-risk genotypes of rs4919510; WVa + VVa + WWb indicate the combination of the high-risk genotypes of both rs6505162 and rs4919510.

