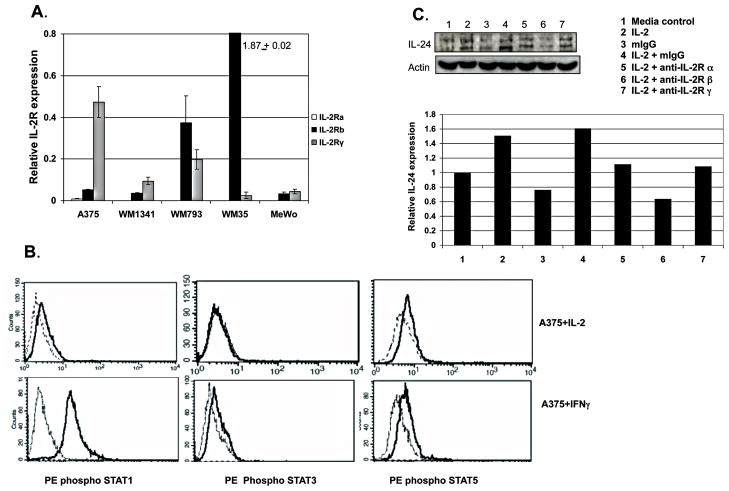
Figure 3. Functional IL-2Rβ and IL-2Rγ are expressed in melanoma cell lines and blocking IL-2R suppresses IL-2 effects.
IL-2 Rβ and IL-2Rγ are expressed on melanoma cells as determined by RT-PCR (A). These receptors are functional as shown by activation of STAT1 and 5 after stimulation with IL-2. Shown (B) are phospho STAT1 (left histograms, upper row) and phosphp STAT5 (right histogram, upper row) expression in A375 stimulated overnight with media (dotted line) or IL-2 (solid line) and measured by phospho flow cytometry. STAT3 is not activated by IL-2 treatment (center histograms, upper row, solid line). Positive controls for these experiments are A375 treated with IFNγ (solid line histogram) where phosphoSTAT1 (left histograms, lower row) as well as phospho STAT3 (center histogram, lower row) and phospho STAT5 (right histogram, lower row) cells are detected. Pre treatment of WM1341 with anti IL-2Rβ or anti-IL-2Rγ inhibited the expression of IL-24 in cells treated with IL-2 as measured by immunoblotting (C). The graph shows relative IL-24 expression levels determined by densitometry and normalized against β-actin.

