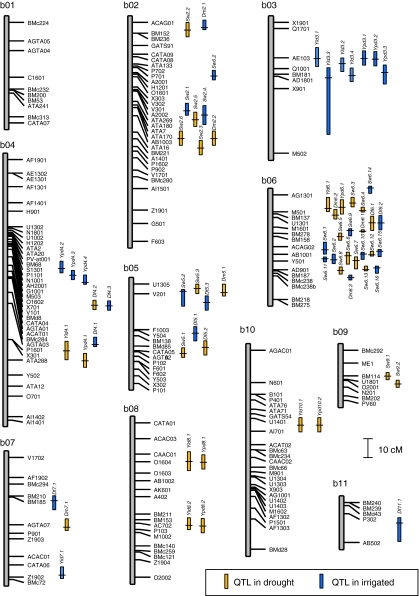
Fig. 3.
QTL for yield, yield per day, seed weight, days to flowering and days to maturity on the genetic map of the DOR364 × BAT477 recombinant inbred line population (refer to Tables 5 and 6 for QTL names). Vertical lines for each QTL represent the range of the QTL that are above the LOD threshold; horizontal marks on the lines indicate the LOD peak for the QTL; and QTL found in drought versus irrigated treatments are coded in different colors

